A data analyst who writes Python has rarely written a system. They wrote a script, then another one, then a third that reads the output of the first two.
None of them was designed as infrastructure, and all of them became infrastructure. The scheduler that fires the three lives on somebody’s machine, and the only failure notice is the report that did not arrive on Monday.
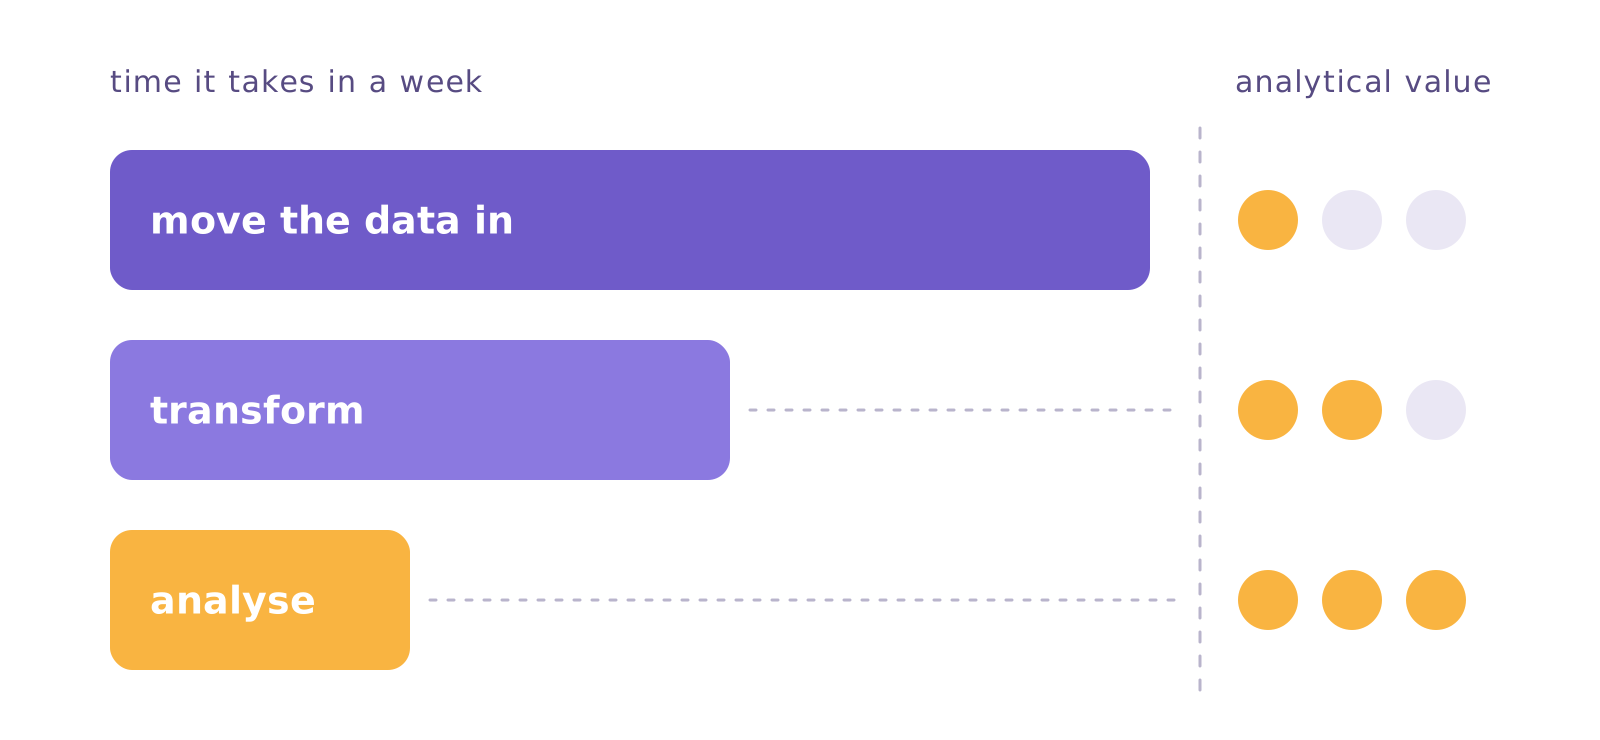
The problem is that "using Python for data" describes three very different activities, worth very different things. One of them justifies the language on its own. Another is habit, and there is a simpler alternative. The third is maintenance nobody asked for and nobody budgeted.
In this article we separate the three layers — moving in, transforming and analysing — and show which one is worth keeping in Python.
Layer 1 — moving the data in
This is the script that calls the API, handles the response and writes it somewhere. Writing the first version is quick: an afternoon does it. What nobody budgets is what comes next.
- Authentication that expires and has to be renewed mid-run.
- Results split into pages, each API with its own pagination rule.
- Rate limits, which force you to wait and try again.
- The API that changes format without telling anyone.
- Tracking what was already read, so you do not pull the whole base every time.
- A record of what happened, so somebody can explain Tuesday’s failure.
- Scheduling, and a way to know it did not run.
None of this is data analysis: it is systems engineering, written by someone hired to do something else.
And the real cost is not in the writing, it is in the ownership. One script is manageable, but fifteen are a system with no owner, no failure alert and nobody who can explain why that field looks different.
A concrete example
A marketing team tracks cost per lead on a dashboard fed by a script that reads the ads API every night. In March, the API starts requiring a new parameter and returns only the first page of results. The script does not break: it writes what it got and finishes successfully. The dashboard keeps refreshing with a third of the data, and nobody notices until month-end close.
The question that exposes the risk is a different one: if the person who wrote it leaves, does anyone maintain it? A script that fails quietly is worse than a broken one.
Layer 2 — transforming the data
Here Python shows up out of habit more than out of need.
Reading three tables with pandas, joining, grouping, calculating and writing the result is an operation the database does better. Not for elegance — for three concrete reasons.
Memory. pandas loads everything before processing, and the database does not have to. Past a certain volume, the script dies out of memory where a query would run without effort. The classic symptom is code that runs on your machine and dies on the server.
Reproducibility. The order of operations in a long script matters, and it is not always explicit. In SQL, the declaration is the result.
Who can read it. A transformation in SQL can be read, reviewed and fixed by anyone on the data team. The same calculation in pandas tends to have exactly one reader: whoever wrote it.
There are legitimate exceptions. Complex text handling, a call to an external service in the middle of the transformation, logic SQL expresses badly. In those cases Python is the right answer, and there is no reason to force it elsewhere.
Outside those exceptions, the database transforms better and cheaper.
Layer 3 — analysing the data
This layer does not leave Python, and it should not. This is where the language does what no other tool in the flow does.
Regression, time series, statistical clustering, hypothesis testing, forecasting, simulation. A chart that needs fine control over every axis. Exploratory analysis where the question changes with every cell you run.
SQL does not do this, and neither does a dashboard tool. It is the highest-value work in the whole flow, and it is exactly what suffers when layers 1 and 2 eat the week.
Notice what sets the three apart. The first two are means: nobody hires a data team to authenticate against an API or to join tables. The third is the end — the answer somebody asked for, and the only one that shows up in the meeting.
Anyone promising to replace this layer with an interface is selling something that does not exist. No interface asks the question for you.
How to tell which layer costs you
Three questions, and the honest answer usually stings:
How much of your week is layer 1? If more than a third of the time goes into moving data in and fixing what broke while moving it, the bottleneck is not analytical.
How many of your scripts can somebody else maintain? If the answer is none, that is not a technical asset, it is risk concentrated in one person.
When was the last real analysis you did? A model, a test, an investigation. If the answer is "a while ago", layer 3 is being crushed by the other two.
If all three answers point the same way, the problem is not the language. It is the division of labour.
Where Januss comes in
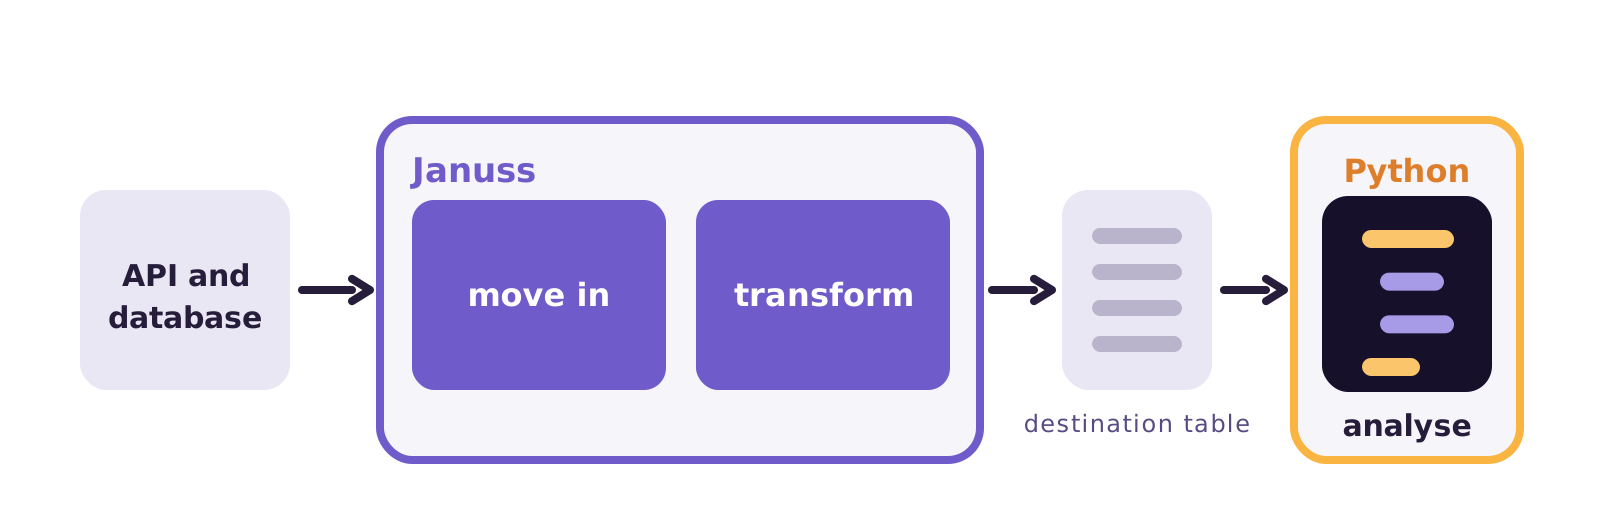
Januss covers layers 1 and 2, and does not touch layer 3.
In layer 1, the AI writes the connector from the API’s OpenAPI spec or from the documentation you paste in. It works out authentication and pagination, and the connector is only saved after a real call that managed to read the data. After that it is deterministic: extraction runs the same way every time, with no AI in the path of the data.
Scheduling, retries on failure, email alerts and tracking of what was already read come with it. For databases, the reading comes from the transaction log, which settles incremental loads and deletions with no code at all.
In layer 2, the transformation is written in SQL and runs inside the destination database, with dependencies between steps and reprocessing limited to the scope that changed. Before that, thirteen conversion rules per column — currency, date, number, text — with eight regional formats, and the decision, column by column, between stopping the run and writing null. Declared tests can stop the load when the data arrives wrong.
In layer 3, nothing changes. The database being fed remains the source for your analysis environment. pandas.read_sql is still there. The difference is that it reads from a reliable table, updated on its own, instead of reading the output of a script that may or may not have run.
It is worth saying what this is not: it is not "data analysis without programming". Anyone building statistical models in Python will go on doing it, and should. What leaves the plate is the part that was never analysis — the part that eats the week and shows up in no report at all.
Want to see it with a source of your own? The 14-day trial does not ask for a card: create your workspace.
Create your workspace in minutes.
Point at your source and watch the data reach the database the same day.