
Every BI team reaches the same point. The data model is ready, the metrics are validated, the dashboard is already being shown to the board. Then someone asks whether the CRM data could be included too.
The data is there. The API exists, it is documented and it returns what was asked for. And the honest answer is still the same: yes, but it will take time.
This is not a shortcoming of your team. Keeping an API integration running every day is data engineering work, not analysis. Authentication that expires, results split across pages, call limits, a data structure that changes without warning. None of that is in the API documentation. All of it shows up on the Monday the report did not refresh.
In this article we compare the five possible paths for getting API data into your BI tool. What each one solves, where each one breaks, and the questions that settle the choice before you sign anything.
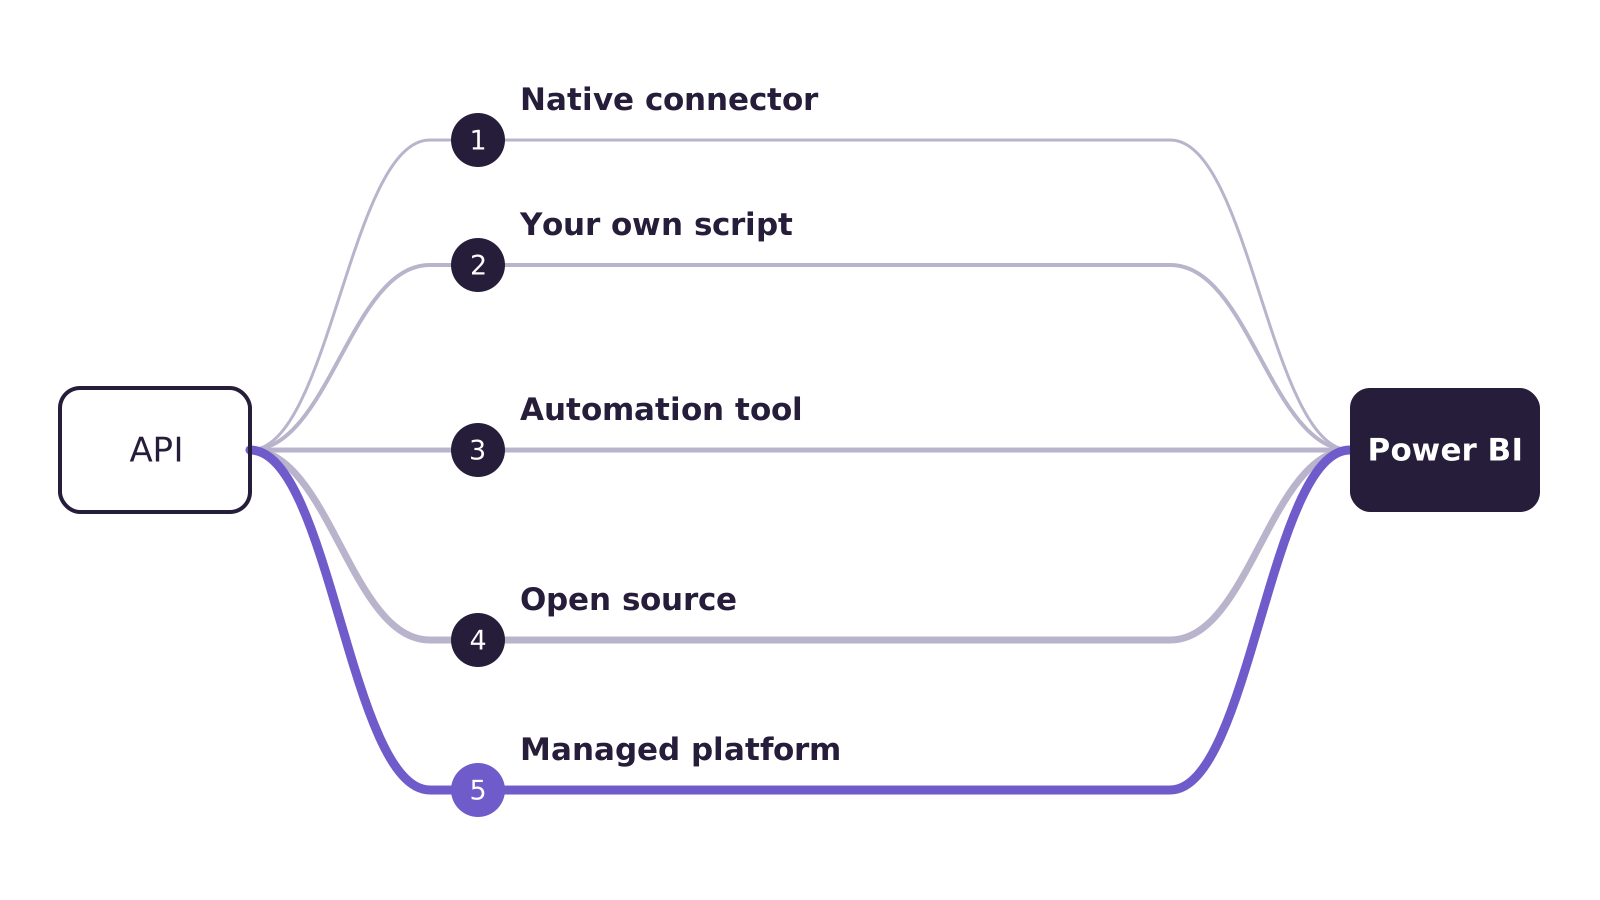
Here they are:
- The native Power BI connector — Power Query calling the API directly.
- Your own script — your code, scheduled, writing to a database.
- An automation tool — Zapier, Make, n8n.
- An open source tool — Airbyte, Meltano, hosted by you.
- A managed platform — someone else handles extraction and loading.
Path 1 — the native connector holds until the second page of results
Power Query has a Web connector. You point it at a URL, it brings the data back, you clean it up in the editor. For a public exchange-rate endpoint or a reference table, that is the right answer. Building infrastructure for that would be overkill.
The trouble starts when the API splits results across pages. Walking page by page becomes a loop inside Power Query, and that loop is slow. Authentication that renews itself is also hard to maintain there. The data gateway turns into a point of failure nobody monitors.
And there is a loss that is almost never noticed in time: history. If the API only returns the current state, the past is stored nowhere. An order that went through three statuses reaches your model as a single row, always the most recent one.
The symptom is refresh time climbing every week. By the time you notice, the Power BI file has become the company's data pipeline. Nobody decided that.
Path 2 — your own script is a good decision until it multiplies
A script calls the API, handles the response and writes to a database. You schedule it and it works. If someone on the team knows how to program, this path is legitimate, flexible and free of license costs. Worth stating plainly, because a lot of vendor-published material leaves that out.
What changes is scale. One script is manageable. Five become a system — with no failure alerts, no automatic retries, no dependency control between runs and no formal owner.
The question that exposes the real cost is simple: if that person leaves tomorrow, will anyone maintain it? The answer is usually no. And the knowledge leaves with them.
The problem is never the first script. It is the fifteenth.
Path 3 — an automation tool moves records, it does not manage tables
Zapier, Make and n8n were built to react to events. A new record comes in, a row gets written. In that scenario they are effective, and the visual interface lowers the barrier to entry.
The math changes with volume. Pricing is usually per operation or per run. Loading hundreds of thousands of rows a month under that model raises the cost quickly, and the initial historical load can consume a whole month's allowance in the first week.
There is a difference that matters more than price. These tools move records; they do not manage tables. Incremental loading, control over table structure, reprocessing a period and removing what disappeared at the source are not part of their vocabulary.
Process automation and analytical data integration look equivalent on a diagram. They are not.
Path 4 — open source costs no license, but it costs operation
Airbyte, Meltano and tools of that kind deliver a large connector catalog and full control, with no license cost. For anyone with infrastructure, it is a serious option.
The weight sits on one word: operate. Self-hosting means taking on the server, version upgrades, monitoring, backups and fixing the connector that stopped working after an update. The software is free. The operation is not.
A concrete example
A retailer with two BI analysts installs Airbyte on its own server. It runs fine for three months. On the fourth update, the ERP connector stops returning two columns. Nobody notices for six days, because the pipeline keeps recording successful runs. The margin report stays wrong for the whole week, and the team finds out in the results meeting.
For a team of one or two people, that means becoming the administrator of a platform that was nobody's job.
Path 5 — the managed platform solves it, if your source is in the catalog
In this model you hire a service responsible for extraction, loading and scheduling. You configure source, destination and frequency; the platform handles authentication, pagination and incremental loading. This is the path that turns data integration into a routine instead of a project.
The breaking point is the catalog. Most of these platforms work from a closed list of ready-made connectors. That covers Salesforce, HubSpot and Google Analytics. It does not cover your industry's ERP, the internal API your team built, or the niche system your operation runs on.
If your source is not on the list, you depend on another company's product roadmap. It is the most common reason an evaluation ends in "does not meet our needs".
Before signing with any platform, six questions separate the ones that fit from the ones that only look like they fit:
- Does the tool depend on a catalog, or can it build the connector itself? Some read the technical specification the API publishes, others read the written documentation. The question shifts from "do you have that connector?" to "is that API documented?".
- Who handles authentication and pagination? Credentials that expire, keys that need renewing, results split across pages, fields nested inside fields. If that stays with your team, path 5 has become path 2 with a monthly bill.
- Is the configuration validated before it is saved? A connector that looks ready and breaks on the first production run is worse than an error on screen.
- If artificial intelligence is involved, at what point does it act? Writing the connector once is one situation: extraction then runs the same way every time, with no variation. Artificial intelligence processing the data on every run is another. Ask directly.
- What happens when the API changes shape? A new field, a removed field, a changed type. Does the tool warn you, or fail silently? And if the destination table has to be recreated, does it ask for confirmation before dropping existing data?
- Is billing based on rows read or rows written? If every transformation that writes also consumes your allowance, your bill is not the source volume. Ask whether there is a billing cap and whether you get a warning before you go over it.
Predictability, in this context, does not mean a low price. It means no surprise on the invoice.
The work left over on every path: it all comes back as text
Once the path is chosen, there is still a task that almost never makes it into the effort estimate.
What the API returns has very few data types. Your model needs many more. In practice, this is what arrives:
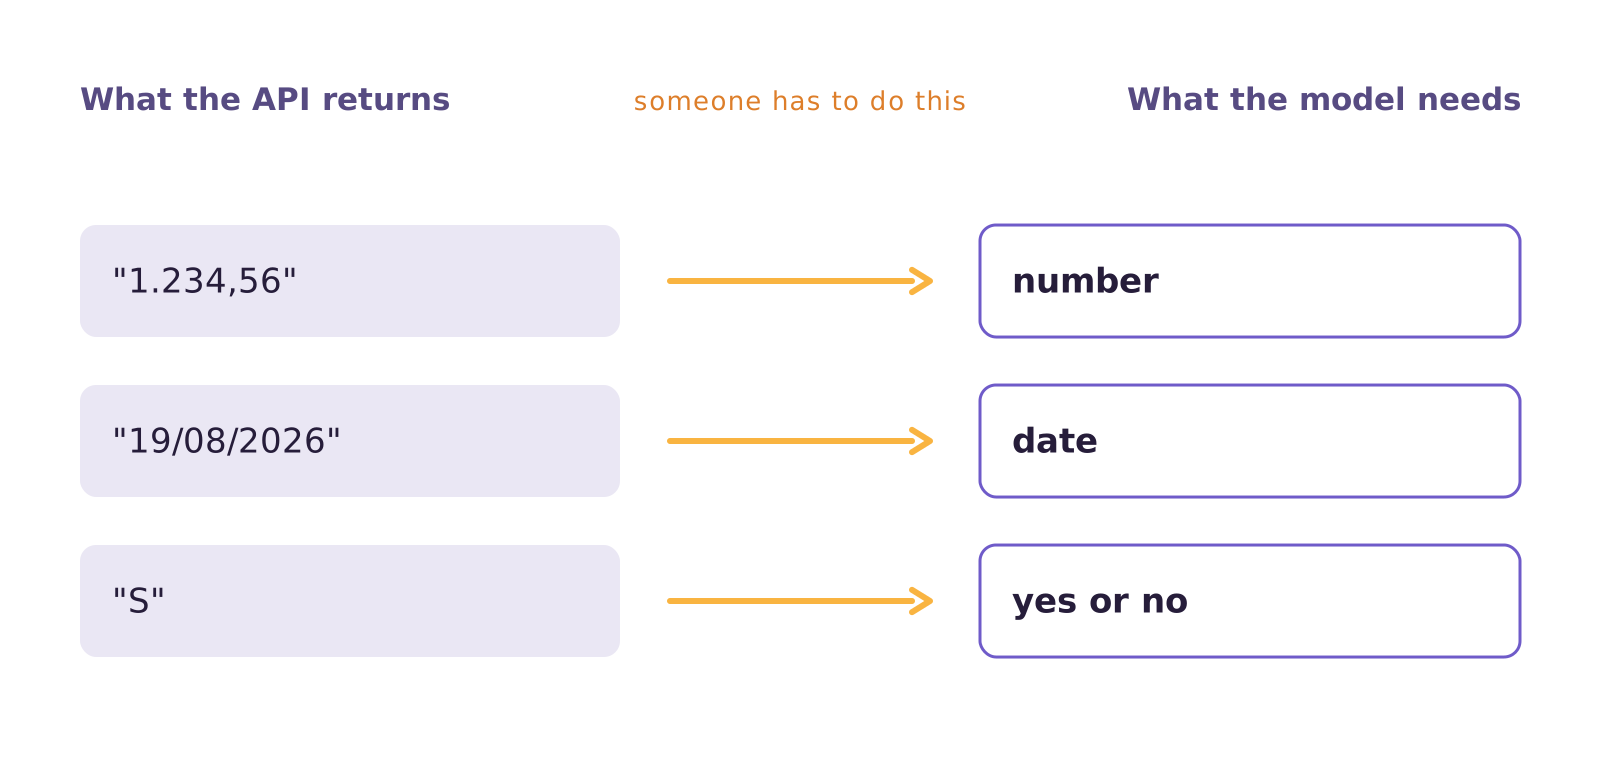
- "1.234,56" — a monetary value as text, in Brazilian format. Power BI reads it as text and the calculation returns zero.
- "19/08/2026" in one API and "2026-08-19T00:00:00Z" in another — both in the same dashboard.
- "S" and "N" where you expected a yes-or-no field. Or 1 and 0. Or the word true written as text.
- Nested fields — a customer inside an order inside a list. That structure has to be flattened into tabular form.
- Inconsistent records — and a decision to make: does the whole load fail, or does that field get written empty?
Doing this in Power Query works. But it locks the business rule inside the Power BI file, where nobody else can see it and nobody can track changes to it. The next report will redo all of it from scratch.
When evaluating any paid tool, this is the most concrete test available. Ask it to convert R$ 1.234,56 into a number and 19/08/2026 into a date, with the option to write empty when the value is invalid instead of stopping the run. A tool built for the American market treats this as an exception.
In Brazil, it is the common case.
How to choose between the five paths
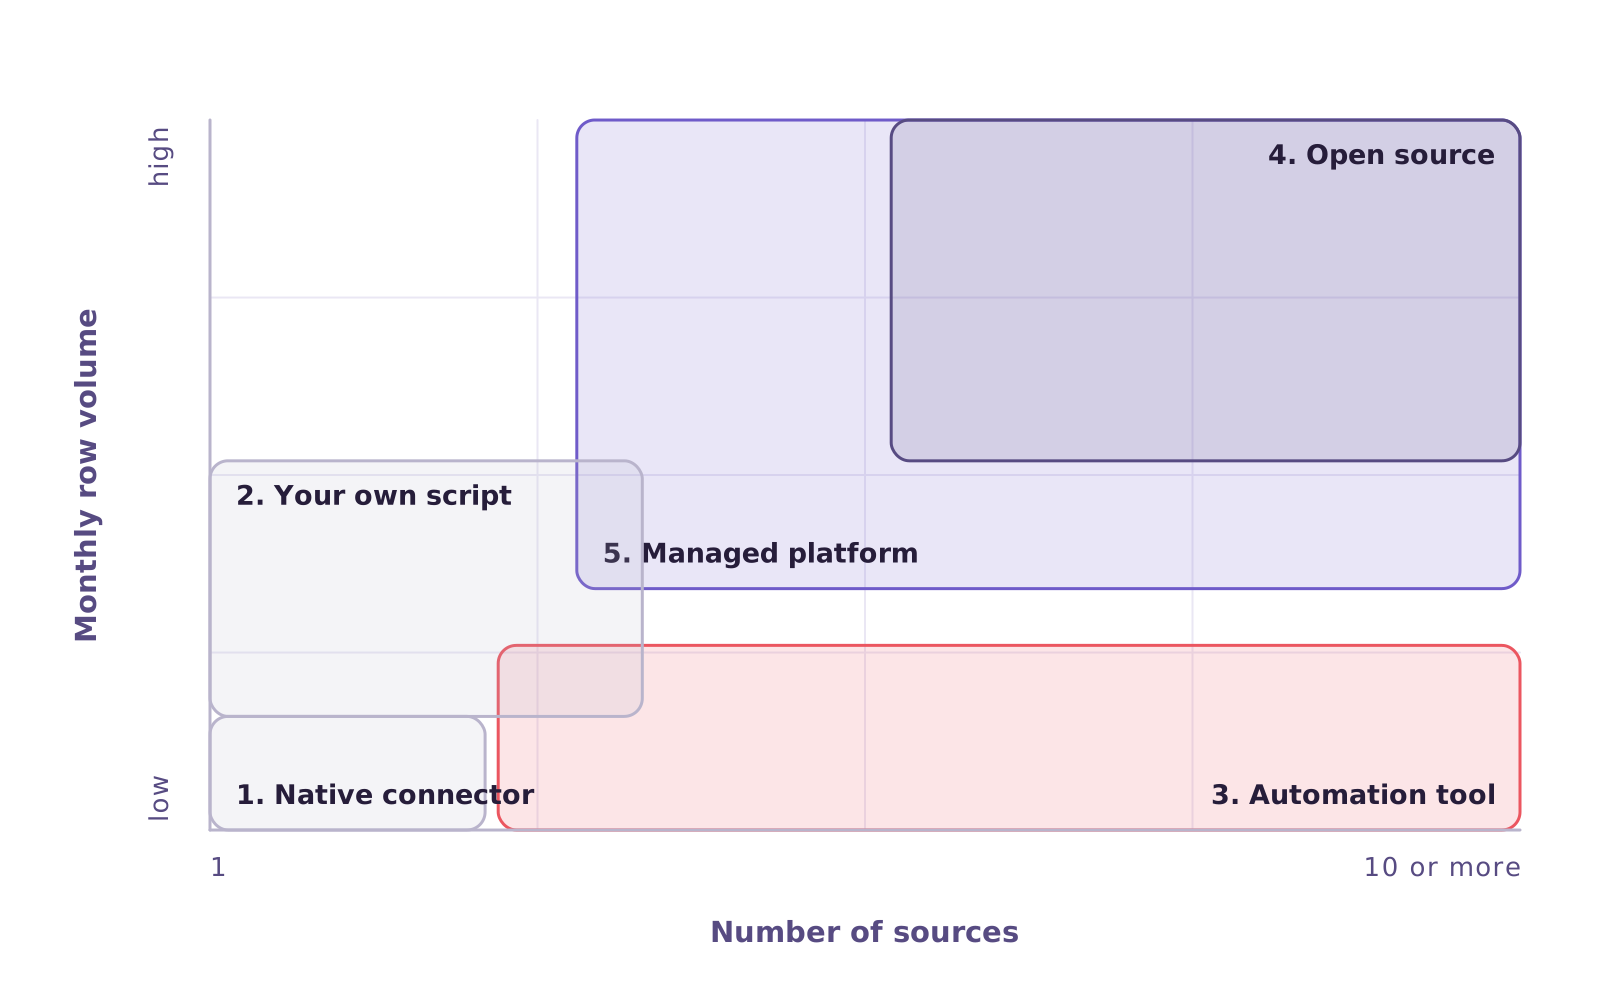
Four questions settle most cases. The table comes afterwards, to confirm.
1. How many sources will you have twelve months from now? One? A script or the native connector will do. Five or more? Any one-off solution becomes technical debt.
2. Do you need history, or only the current state? Many APIs return only the present. If your analysis depends on how the data changed, history has to be built during the load. That rules out paths 1 and 3 immediately.
3. Is your source in somebody's catalog? If your APIs are the popular ones, almost anything works. If you depend on a niche system or an internal API, the tool has to be able to generate the connector from documentation.
4. Who gets the call when the load fails at seven in the morning? This is the decisive question and the one most often avoided. If the answer is "me", the real cost of the free option is your time. And is there anyone else with access to check? A script installed on one person's machine and a single-user tool have the same problem during that person's vacation.
With those four answered, the table confirms the choice:
| Volume | Sources | Needs code | Upfront cost | Cost at scale | Keeps history | |
|---|---|---|---|---|---|---|
| 1. Native connector | 1 | no scale | ||||
| 2. Your own script | 1–3 | in time | manual | |||
| 3. Automation tool | several | |||||
| 4. Open source | several | infra | ||||
| 5. Managed platform | several | predictable |
On paths 4 and 5, keeping history depends on picking the right write mode. Overwrite is the default in most tools — confirm before you sign.
Where Januss comes in
With Januss, the API does not have to be in a catalog. You point at the technical specification it publishes, or paste the written documentation, and Januss builds the connector and assembles the list of available tables. It works out on its own how the API asks for authentication and how it splits results across pages.
The configuration is not accepted without verification. Before saving, Januss makes a real call to the API and checks that it could read the data that came back. A connector that fails does not make it into the catalog.
The artificial intelligence writes that connector once. From then on extraction runs the same way every time, with no artificial intelligence in the data path.
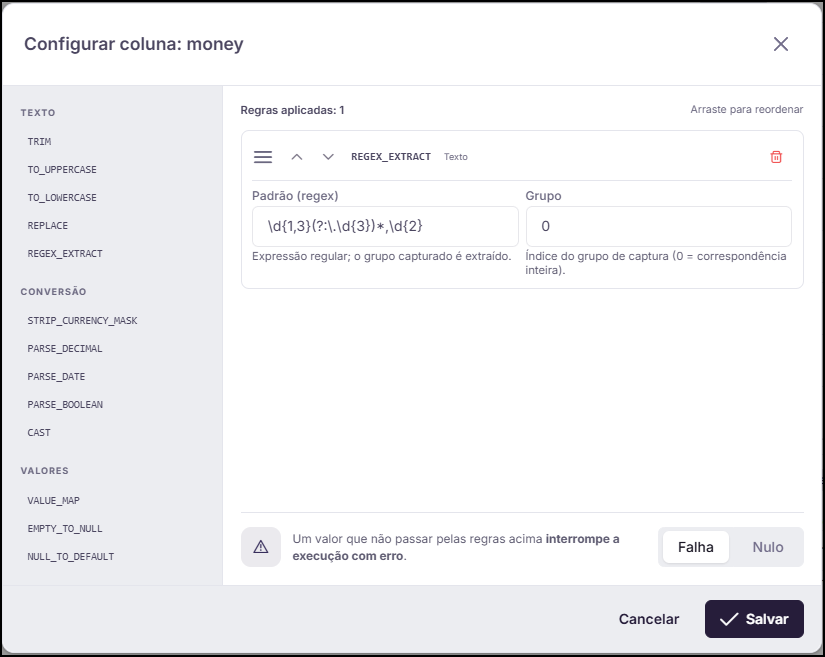
Format handling belongs to the load step, not inside the Power BI file. There are thirteen conversion rules you chain per column, across eight regional formats. R$ 1.234,56 becomes a number and 19/08/2026 becomes a date. And you decide, column by column, what happens to a value that will not convert: stop the run or write empty.
Not every case is solved this way. If the API has no documentation at all, there is nothing to interpret, and the path becomes a different one. Worth checking before you start the trial.
Choosing an integration path has no single answer. There is the answer that fits your volume, your number of sources and the size of your team. Want to check it against your own API? It is a 14-day trial, no credit card: create your workspace.
Create your workspace in minutes.
Point at your API documentation and watch the data reach its destination the same day.