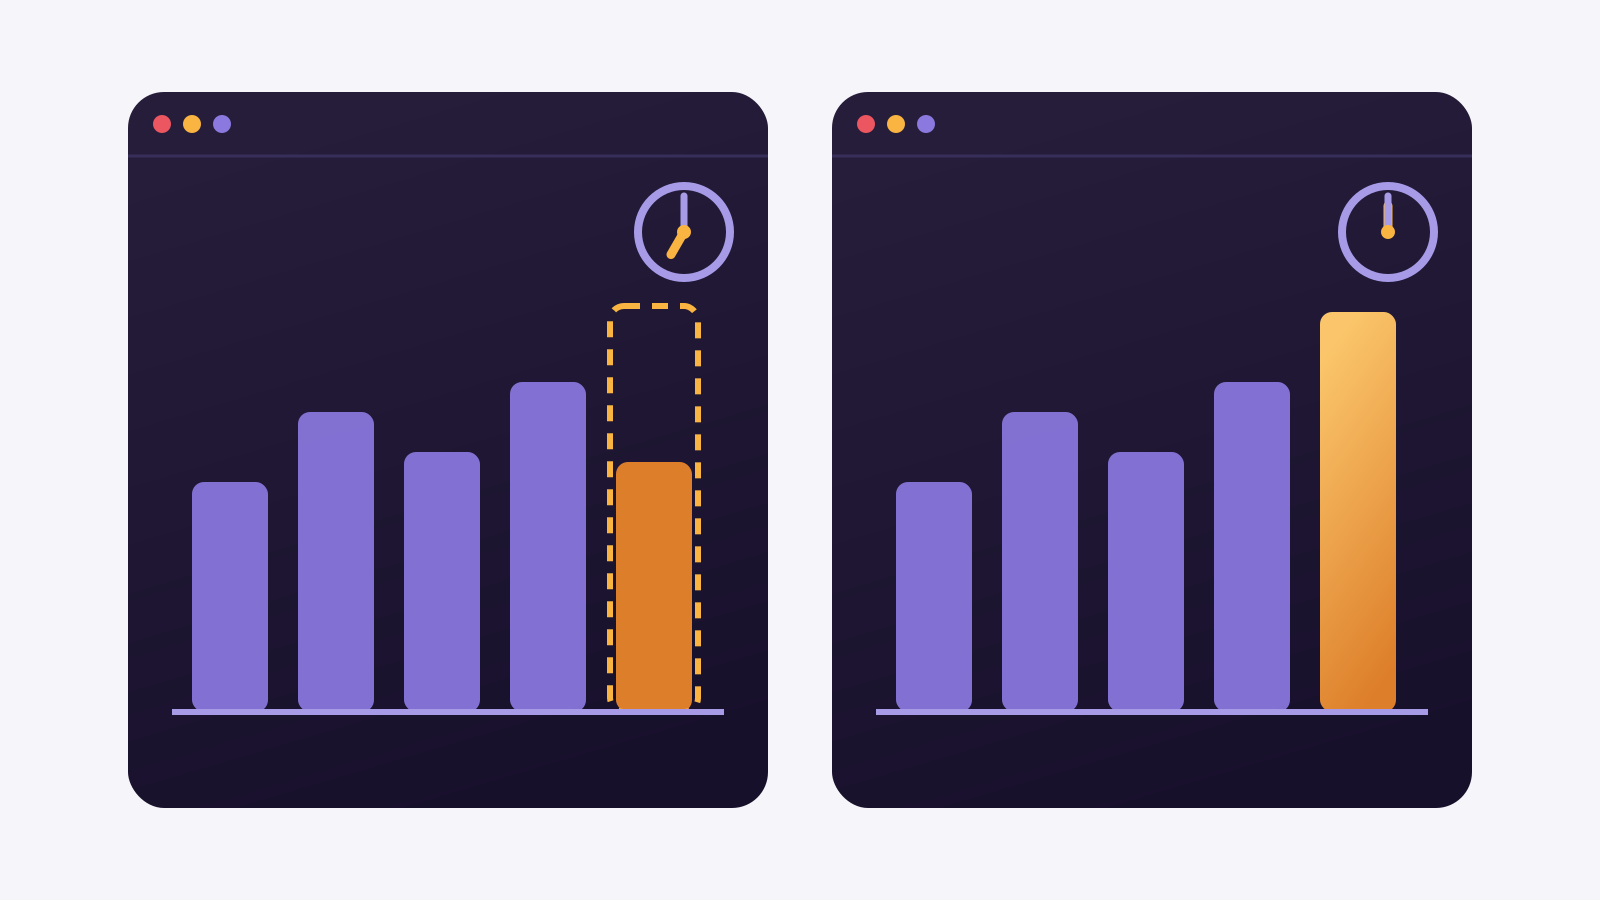
It is the morning after Black Friday. At 7 a.m., the e-commerce director takes a screenshot of the dashboard with Friday's order total and sends it to the board.
At noon, the same dashboard shows a bigger total for the same Friday. Nobody touched the measure. The board asks which of the two counts, and the BI analyst has no ready answer.
Both are right. However, each one was taken at a different moment of a day that was still closing, and the dashboard does not say which.
In this article we explain why a day that is over keeps changing, how Power BI decides what today is, how to state the cutoff on the dashboard itself and what waiting costs.
Two correct numbers for the same day
Data Engineering Weekly published the example on September 30. A snapshot taken at 6 a.m. showed 41,200 orders for Tuesday. The continuous count reached 43,050 by noon. Both numbers were correct.
The gap is not a calculation error. It is Tuesday data that kept arriving after Tuesday ended. Three mechanisms produce it, and they almost always show up together.
- Late records carrying the original date. The marketplace order syncs hours later but keeps the purchase date. A payment confirmed the next morning changes the status of yesterday's order.
- A load that runs before the source closes. If the order system's nightly routine ends at 5 a.m. and the load runs at 4 a.m., the snapshot catches half a day.
- "Today" computed in another time zone. If the service uses UTC, the day turns three hours before the Brasília clock does.
All three can be fixed. No fix works if the dashboard hides when the snapshot was taken.
The two numbers are snapshots from different hours.
When the day actually closes at the source
Midnight is when the calendar turns. A source closes the day when the last record with that date arrives, and every system has its own hour for that.
The ERP may consolidate billing in a nightly routine. The payment platform may confirm transactions in a morning batch. The marketplace may return orders hours late on peak days, exactly when the board watches the dashboard most.
A concrete example
An online store loads orders at 6 a.m. The order system finishes its nightly routine at 5 a.m., but marketplace orders keep arriving until 10 a.m. with the previous date. The 6 a.m. snapshot catches the store's own orders whole and the marketplace by half. At 10 a.m. the day really closes.
Finding the real hour takes one query: for each day, the time of the last record that came in with that date. Run it for a few weeks and the pattern shows.
Each source closes the day on its own hour.
How Power BI decides which day is today
According to Microsoft's documentation, incremental refresh computes the current date and time in UTC, unless you set another time zone in the Refresh section of the model. Microsoft's own example is a refresh at 8 p.m. Pacific time, which in UTC is already the next day.
In Brazil the math is the same, with a different number. On Brasília time, 9 p.m. is already midnight UTC. A 10 p.m. refresh with no time zone set treats the next day as today.
Only refresh complete days. This option exists for exactly that. The documentation example is a 4 a.m. refresh that should not count records between midnight and 4 a.m., because the day is still half done.
The scheduled refresh page notes that slot times are not exact. The target is to start within 15 minutes of the slot, with up to an hour of delay when capacity is short, and a refresh can start up to five minutes early.
The snapshot time is approximate. The dashboard has to say which.
How to state the data cutoff on the dashboard
The cheapest fix does not change the pipeline. It changes the dashboard: a card that says "data until" and the current day flagged as partial.
Data cutoff and partial day
-- how far the dashboard data goes
SELECT max(loaded_at) AS data_until
FROM   sales.orders;

-- today flagged as partial
SELECT order_date::date                        AS day,
       count(*)                                AS orders,
       order_date::date >= (SELECT max(loaded_at)::date
                            FROM sales.orders)  AS partial
FROM   sales.orders
GROUP  BY 1;
The load timestamp column has to exist in the destination table. If you own the load, write it on every row. If you do not, ask the team that runs the pipeline.
With the card on top, the 7 a.m. screenshot now carries the snapshot time. The board question changes from "which number counts" to "has yesterday closed yet?", and that one has an answer.
A dashboard that states its snapshot time ends the argument.
What waiting for the day to close costs
Waiting for the day to close has a price, and on peak days it shows. If the load only runs after 10 a.m., the board spends the morning without yesterday's number.
- Load later. The morning number is stable, but it arrives after the meeting already happened.
- Load more often. The number shows up early and keeps climbing. Each snapshot needs its time attached, or it becomes the problem from the opening.
- Show complete days only. The dashboard never drifts, but it hides the current day, which is what e-commerce wants to watch on a promotion day.
Real time does not settle the question. It shows the partial day more often, and the number keeps changing until the source closes.
There is no hour that is right for every source. There is the hour each one closes, and a dashboard that says which snapshot it is showing.
Pick the hour by the source, not by the clock.
Where Januss comes in
In Januss, each pipeline has its own schedule. There are 11 ready-made frequencies, from 5 minutes to 24 hours, and a custom cron for when the source closes at 10 a.m. rather than at midnight.
With a ready-made frequency, the screen shows the upcoming runs in your time zone before you save. The custom cron has no such preview and is read in UTC: to run at 10 a.m. Brasília time, the cron says 1 p.m. It is the time zone trap from the third section, now on the load side.
For the "data until" card, turn on sync columns for the stream. Januss then writes on every row the time it was synced, in _januss_synced_at by default — the account defines the name. The card reads the maximum value of that column.
Januss does not know when your source closes the day. That hour comes from the query in the second section, and you pick it. The Power BI refresh still has its own schedule, and the dashboard only sees the load after both.
Want to see the schedule preview against your own source? The 14-day trial needs no card. Create your Januss trial workspace.
Sources
Power BI behaviour comes from Microsoft's documentation; the two-totals example comes from Data Engineering Weekly:
- Microsoft Learn — Incremental refresh and real-time data for semantic models
- Microsoft Learn — Configure scheduled refresh
- Data Engineering Weekly — Thinking Like a Data Architect (09/30/2026)
Create your workspace in minutes.
Point at your source and watch the data reach the database the same day.