It is the monthly results meeting, and the revenue figure is on screen. The sales director looks at it and says that number does not match what he watched all week.
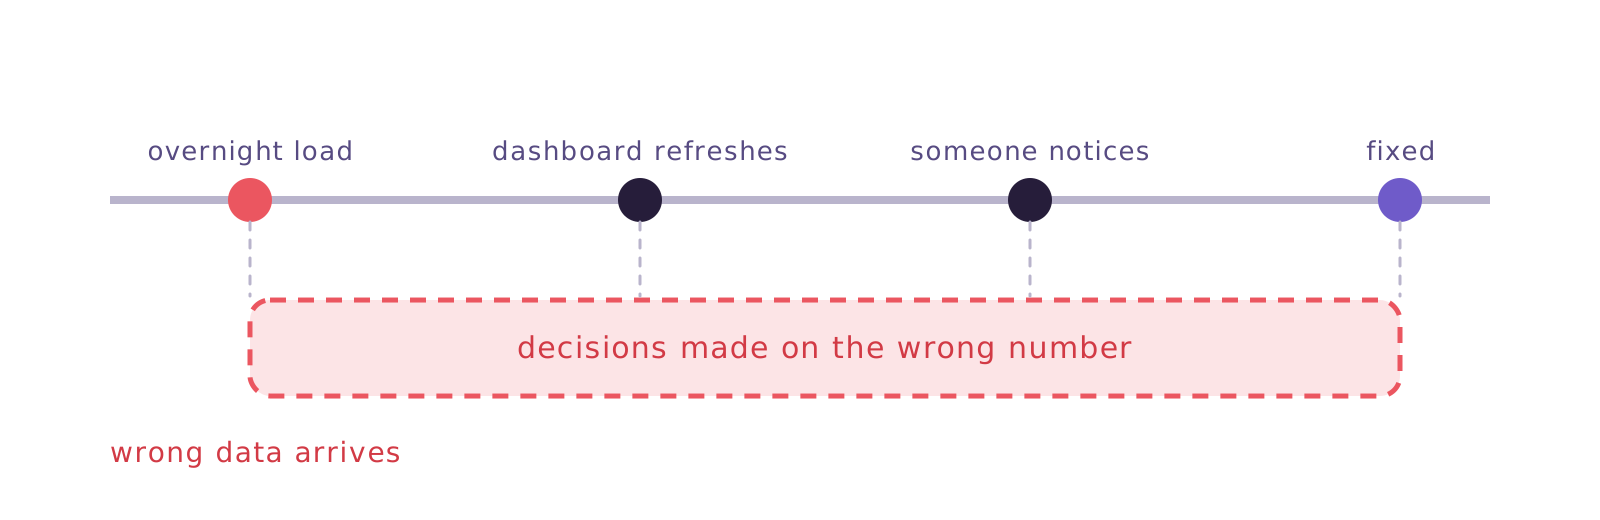
He is right. The overnight load brought the order with the discount zeroed out, the dashboard refreshed at six in the morning and nobody was alerted.
The problem is that there was nothing to alert about. The pipeline did not break: it read the source, converted, wrote to the destination and finished successfully. As far as the run is concerned, it was an ordinary day.
In this article we explain why the data team tends to be the last to know, what separates a loud failure from a silent one, and what changes when the test stops running after the load and starts running during it.
Who finds the error first
The meeting scene is not the exception. It is the measured norm.
In a survey by Monte Carlo with Wakefield Research, fielded in March 2023 with 200 data professionals, 74% said business stakeholders identify data issues before the data team, all or most of the time. The year before, that figure was 47%.
The same study measured the clock: most take four hours or more just to detect an incident, and the average time to resolution came in at fifteen hours per incident. The sample is global, with no breakdown for Brazil — but the mechanics do not change with the country.
And this is where the reading should be inverted. These numbers come from large organisations with structured data teams. If a company with dozens of engineers takes four hours to notice and fifteen to fix, the two-person team does not lose less. It loses the week, because whoever fixes it is exactly who should be analysing.
Finding out late is not carelessness: it is a consequence of where the test sits.
Loud failures and silent ones
A pipeline that breaks is the easy case. The run stops, the alert arrives, somebody opens the log and reads the message. Nobody makes a decision on a wrong number, because no number arrived at all.
The silent failure is the other one. The run finishes successfully and the data lands — just wrong. There is no error message to read, no alert to fire, and the dashboard refreshes as usual. The only signal that something happened is the number itself, and the people who look at the number every day are on the business side.
That is why the order reverses. The data team watches the run; the business watches the result. When the problem does not show up in the run, whoever watches the result sees it first.
The team is not distracted. It is looking at the place where nothing happened.
How the error gets in without breaking anything
Five paths cover most of the cases, and none of them takes the run down:
- A conversion that returns zero. The value arrives as text with a decimal comma, the conversion does not recognise the format and writes zero. The row exists, the total shrinks.
- A duplicate key in the source. The same order arrives twice, and the sum counts it twice. The load has no reason to complain.
- A broken relationship. The order arrives with a customer that does not exist in the customer table. The per-customer report loses those rows quietly.
- A deletion that is never captured. The source deleted the record, a scheduled query has no way of noticing, and the destination keeps counting what no longer exists.
- An empty required field. The column that feeds the dashboard filter arrives null, and those rows simply drop out of the view.
A concrete example
A retail chain changes payment providers in its sales system. The card brand field starts arriving with a new code, one that is not on the dashboard’s list of accepted values. The load runs normally and writes everything. The sales-by-brand report starts showing a large blank slice, and nobody notices until the closing meeting — when someone asks why half the sales have no brand.
None of these cases is exotic, and every one of them finishes the run successfully.
Testing after the load and testing during it
The difference between finding out in the meeting and finding out before it is almost always the moment the test runs.
Testing after the load. The table is built, and a query checks the result. It works, and it is how most tools operate. The point is that by the time the test flags anything, the data is already in the destination — and the dashboard has already read it from there.
Testing during the load. The check happens on the way, before the write, and it can stop the run. If it does, the destination stays as it was: the dashboard keeps showing yesterday’s number, which is right, instead of the new one, which is wrong.
The difference shows up in the window. Testing afterwards shortens detection time, and it beats not testing by a long way. Testing during closes the window in which somebody decides with the wrong number on screen.
What a test does not catch
It is worth being blunt here, because a declared test is not insurance against everything.
It does not catch a business-rule error. If revenue was calculated with the wrong tax rate, the value is a plausible number, not a null or a duplicate. No structural check will complain about a number that looks right.
It does not catch what nobody declared. A test is an assertion somebody wrote: this column cannot be null, this value has to be on this list. What was not written is not checked, and the list grows over time, alongside the errors that showed up.
And stopping the load has a price. An interrupted pipeline means a stale dashboard, and stale bothers people too. There is a decision to make per test, between merely recording a warning and actually stopping — and it is not obvious.
The rule of thumb that works: stop when the wrong number is worse than the old one. Revenue, balances, stock, commission bases — there the old number is the lesser evil. For a supporting column nobody sums, a warning is enough.
Not every table deserves a brake.
Where Januss comes in
In Januss the test is part of the load, not a separate step after it.
There are five types: not null, unique, accepted values, relationship between tables, and custom SQL for the case the other four do not cover. Each one carries a severity. Warning only records it; Error stops the run and blocks the steps that depend on it. The failing data does not reach the destination, and whatever came next does not run on top of it.
Before that, still in the conversion, there is the per-column error policy: a value that does not convert can stop the run or become null, and the choice is yours, column by column. That is the zeroed discount, settled before it becomes a number on a screen.
When a run stops, the email goes out with the error and a direct link to the run. When it runs clean again, the recovery email follows. And after three failures in a row the pipeline shuts itself down, instead of pressing on quietly.
What Januss does not do, and it belongs here. It is not an observability platform: it does not detect anomalies on its own, does not draw a dependency map across systems and does not find the test you never wrote. What it does is run the checks you declared, at the moment they can still prevent the write.
Want to see it with a table of your own? The 14-day trial does not ask for a card: create your workspace.
Sources
The market figures in this article come from a single source, opened at the origin:
Create your workspace in minutes.
Point at your source and watch the data reach the database the same day.