At the quarterly meeting, the dashboard is on screen and the sales director points at the drop in one region, asking what happened.
Whoever runs BI answers that the number is not right, because the sales system changed in May and nobody adjusted the load. The conversation carries on by opinion, and the dashboard stays projected in the corner, ignored.
The problem is that this scene describes most companies that call themselves data-driven. They have dashboards, they have KPIs, they have automated reports — and the decision still comes from whoever speaks loudest.
In this article we separate the three levels of maturity that get confused, the condition that comes before all of them, and the cases where deciding with data does not pay.
Deciding with data is when somebody changes their mind
That is the practical definition, and it is uncomfortable: a company decides with data when the data changes a decision that had already been made.
If the number confirms what the board already thought, it decided nothing: it merely came along. The real test happens when the data contradicts the expectation. At that moment it either changes the decision, or it gets questioned until it leaves the conversation.
Everything else — how many dashboards, how big the warehouse, which tool was chosen — is means, and only that is the end. The term itself became a synonym for owning reports, which is not what it says.
Reporting, monitoring and deciding
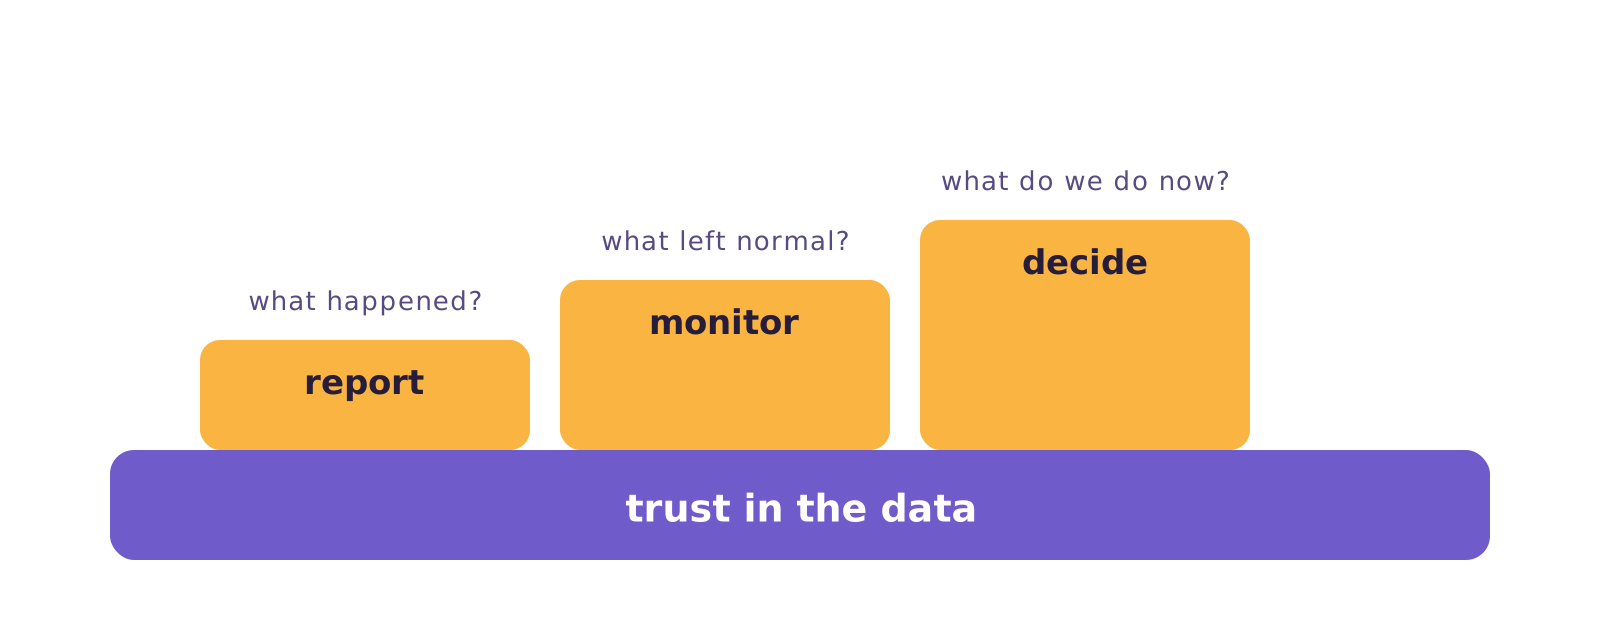
Reporting. The data describes what happened: monthly revenue, orders by region, average ticket. It is the level almost every company is at, and it has value — without a shared description, each department arrives at the meeting with a different number.
Monitoring. The data warns you when something left the expected range. It is not checking the dashboard every Monday: it is being told on Tuesday, when a product’s margin dropped below the threshold. It requires defining what normal is, and that is where most stop.
Deciding. The data comes in before the choice, not after it. Which product to discontinue, which region gets more stock, which customer earns different terms. Here it has to exist, arrive in time and survive questioning.
Jumping from reporting straight to deciding is the most common cause of frustration with data projects. Without the middle level, nobody notices the number is wrong before the decision is made on it.
The condition that comes before the three levels
Deciding with data requires trusting the data. And trust is not built with a presentation: it is built by not being contradicted.
In a survey by Monte Carlo with Wakefield Research, fielded in March 2023 with 200 professionals, 74% said business stakeholders identify data issues before the data team. The sample is global, and we have written about the mechanics of it in why the error shows up first in the meeting.
What matters here is the consequence, and it is organisational. From the second time the number is contradicted in front of everyone, that dashboard has stopped existing for whoever watched.
That person goes back to deciding the way they did before, and stays there even after the error is fixed, because lost trust does not come back with a correction notice.
Hence the order: the data has to be trustworthy first, and only then can it decide. Investing in dashboards before investing in reliability is building the shop window before the stock.
When deciding with data does not pay
Most of the content on this subject treats the data-driven decision as always better. It is not, and there are at least four cases where it is not.
- A cheap, reversible decision. If testing costs less than measuring, test. Changing the text on a button does not need prior analysis; it needs a fast rollback.
- A sample that is too small. Deciding on a pattern seen in twelve cases is deciding by chance with the appearance of rigour. The data gives false confidence, which is worse than declared uncertainty.
- Measuring costs more than the decision is worth. Instrumenting the process, building the collection and keeping it running costs money. If the decision is worth less than that, the right answer is to decide without.
- A decision that rests on values, not on facts. How much margin to give up to enter a new market is a strategy call. The data tells you the cost; it does not choose for you.
A concrete example
A chain with four shops wants to decide whether to change opening hours. Instrumenting footfall by time slot requires a people counter, an integration and somebody looking after it every month. The decision is worth a six-week test in two shops, compared against the other two. Measuring everything would cost more than the outcome of the choice.
Knowing when not to use it is part of using it well.
How this shows up in the result
No percentage promises, because return figures on this subject tend to come from whoever sells the solution. What can be stated are the mechanisms.
- The decision cycle gets shorter. The discussion stops being about which number is right and becomes about what to do. In a recurring meeting, that is most of the time saved.
- The discussion changes axis. It leaves hierarchy and enters evidence. Whoever holds the data can counter whoever holds the title.
- Mistakes get cheaper. Monitoring means finding the deviation in days, not at the end of the quarter. The correction happens while it is still a correction.
- Analytical work stops being wasted. Analysis nobody uses because nobody trusts the data is pure cost. It is the most direct result and the least cited.
None of them shows up in the first month. All of them show up in the first quarter.
Where Januss comes in
Januss does not fix decision culture. No tool does — that is a matter of management, of incentives and of whoever sits at the head of the table.
What it does fix is the layer underneath: making sure the number is not contradicted in the meeting.
Declared tests that stop the run. An empty required field, a key that should be unique and came duplicated, a value outside the accepted list, a broken relationship between tables. Each test can either warn or stop the load, and stopping means the dashboard keeps showing yesterday’s number, which is right, instead of the new one, which is wrong.
It is a choice that looks small and is not. A stale dashboard is explained in one sentence; a wrong dashboard costs the trust of whoever looked at it.
A declared guarantee on incremental loads. On every run, the destination table ends up identical, row by row, to what a full reload would have produced. And when the engine cannot guarantee that — a transformation that aggregates over a join, for instance — it refuses the incremental and explains why, instead of delivering an approximate number nobody will check.
Deletions that reach the destination. The reading comes from the transaction log, not from a scheduled query. A record deleted at the source disappears from the destination too. Without that, the report total ends up larger than reality — and it is the kind of error that only surfaces when somebody compares against the system.
Add the email alert when a load fails, and the pipeline shutting itself down after three failures in a row instead of pressing on quietly.
None of this makes a company data-driven. It only removes the most common reason it cannot be.
Want to try it with a base of your own? The 14-day trial does not ask for a card: create your workspace.
Sources
The figure quoted in the text comes from a single source, opened at the origin:
Create your workspace in minutes.
Point at your source and watch the data reach the database the same day.