Anyone shopping for a data integration platform in Brazil lands quickly on the same two or three options. Pricing in reais, a local invoice, support in Portuguese and a team in the same time zone rule out a good part of the international market before the first conversation.
But that is the floor, not the deciding criterion. Kondado and Januss both clear all four. Both bill in reais, offer a 14-day trial with no credit card, and move data from many sources into databases, spreadsheets and dashboard tools.
What separates them is not on the pricing page. It is in what each one does with the data once it arrives.
In this article we compare the two products point by point. Five axes: history, where the data comes from, what you can do with it afterwards, where it is processed, and what happens when volume goes over.
What the demo does not show
Start here, because it is the deepest difference between the two products — and the one that shows up least in a demo.
Januss reads the transaction log of the source database. That is what change data capture, or CDC, means, and it works on PostgreSQL, MySQL, SQL Server, Oracle and MongoDB. On every plan, including the entry one: it is not an enterprise-tier item.
Reading the log changes what you get to know. A row deleted at the source becomes a recorded event, not a record that simply stopped showing up in a query. An order that goes through three statuses between two runs leaves all three in the log, not just the last one.
That is where the per-table choice comes from. Full load, incremental, mirroring or versioned history, with validity start and end dates — each table in the mode the business question calls for, inside the same pipeline.
Kondado's public material does not mention transaction log reading. Its database connectors page describes hourly, daily or scheduled updates, which describes a scheduled query. On the home page, the minimum advertised frequency is five minutes.
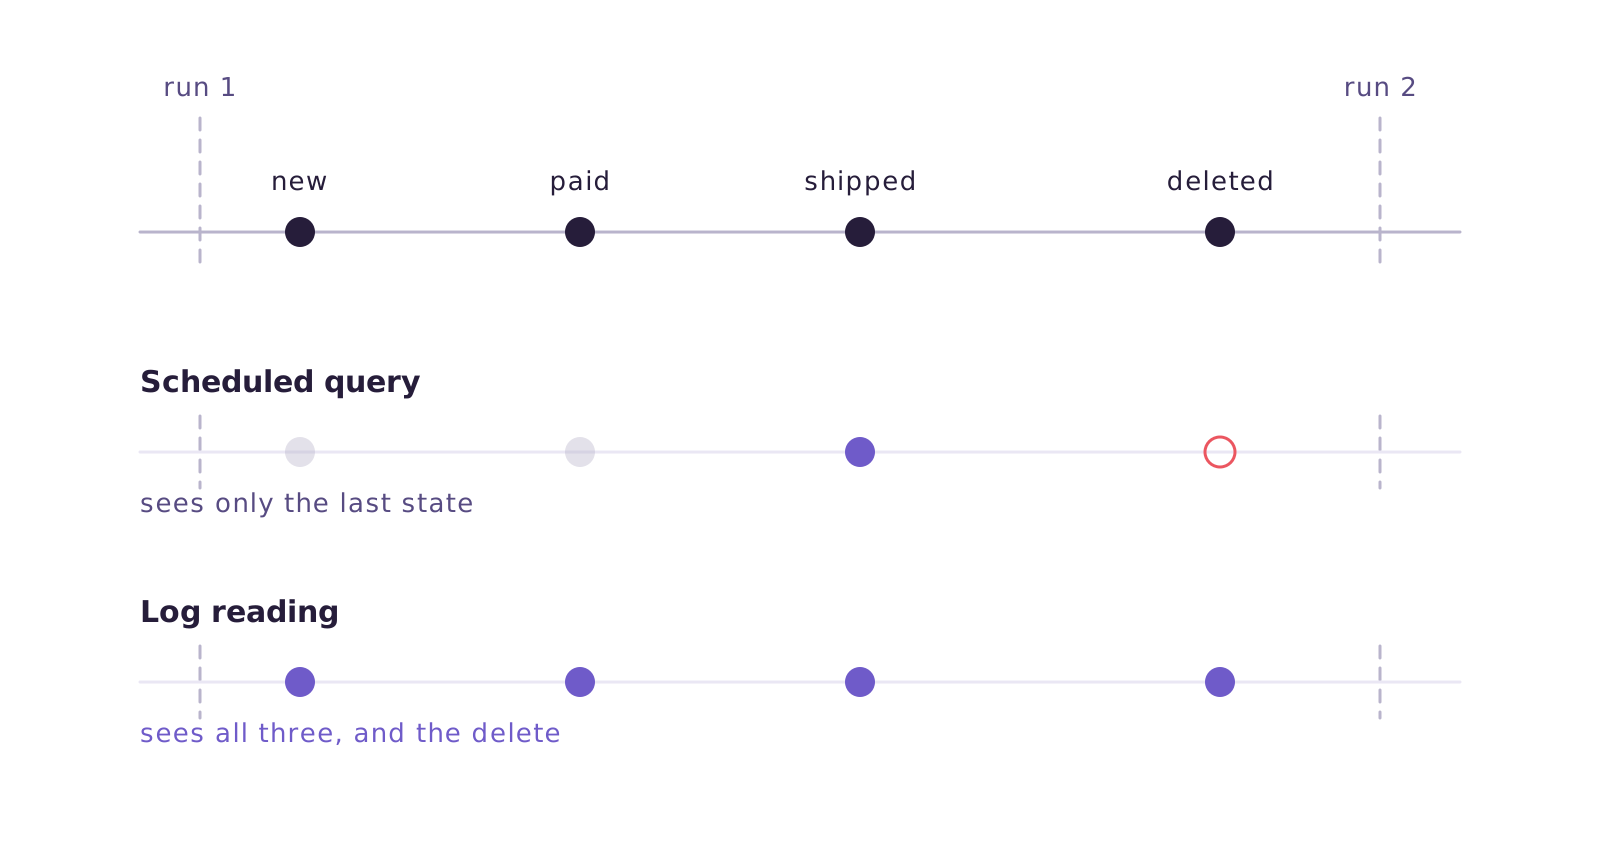
A scheduled query is enough for anyone who needs the current state. If your analysis depends on how the data changed, it does not close the case.
The two, side by side
Before unpacking, the whole picture:
| Januss | Kondado | |
|---|---|---|
| Data sources | A connector generated from the API documentation, with no catalog | A catalog of more than 80 sources, with native Brazilian ERPs |
| Databases | PostgreSQL, MySQL, SQL Server, Oracle and MongoDB, by reading the transaction log | Connectors for the same five databases |
| Frequency | From 5 minutes and, on databases, continuous capture from the log | From 5 minutes; on databases, hourly or daily |
| History | Full load, incremental, mirroring or versioned history, per table | not listed |
| Transformation | Format handled during the load, and SQL in steps with dependencies | SQL materialized and documented, triggered with the integration |
| Quality tests | Declared per table and column, with the option to stop the pipeline | not listed |
| Billing | Per row written at the destination | Per active integration and per volume, in bytes |
| When you hit the limit | Overage charged, with a billing cap per plan | Integrations paused until the cycle turns over |
| Data inside your network | A Runner installed in your own infrastructure | not listed |
Where Kondado shows not listed, that is what its public material does not cover — not a claim that the feature does not exist.
The sections below open up each row.
Where the data comes from
Januss does not work from an app catalog. You point at the technical specification the API publishes, or paste the written documentation, and the platform builds the connector and the list of tables. It works out on its own how the API asks for authentication and how it splits results across pages.
And it does not accept the configuration without checking. Before saving, it makes a real call and confirms it could read the response. A connector that fails does not get in.
That changes the question that decides the evaluation. It stops being "do you have that connector?" and becomes "is that API documented?" — a question you answer yourself, without depending on another company's product roadmap.
Kondado works from a catalog: more than 80 ready-made sources, with an emphasis on the Brazilian market — Bling, Omie, ContaAzul, Tiny, RD Station, Mercado Livre, VTEX, Nuvemshop, Asaas, Pagar.me and Hotmart, among others. If your system is on the list, the connection takes minutes and someone has already solved authentication for you.
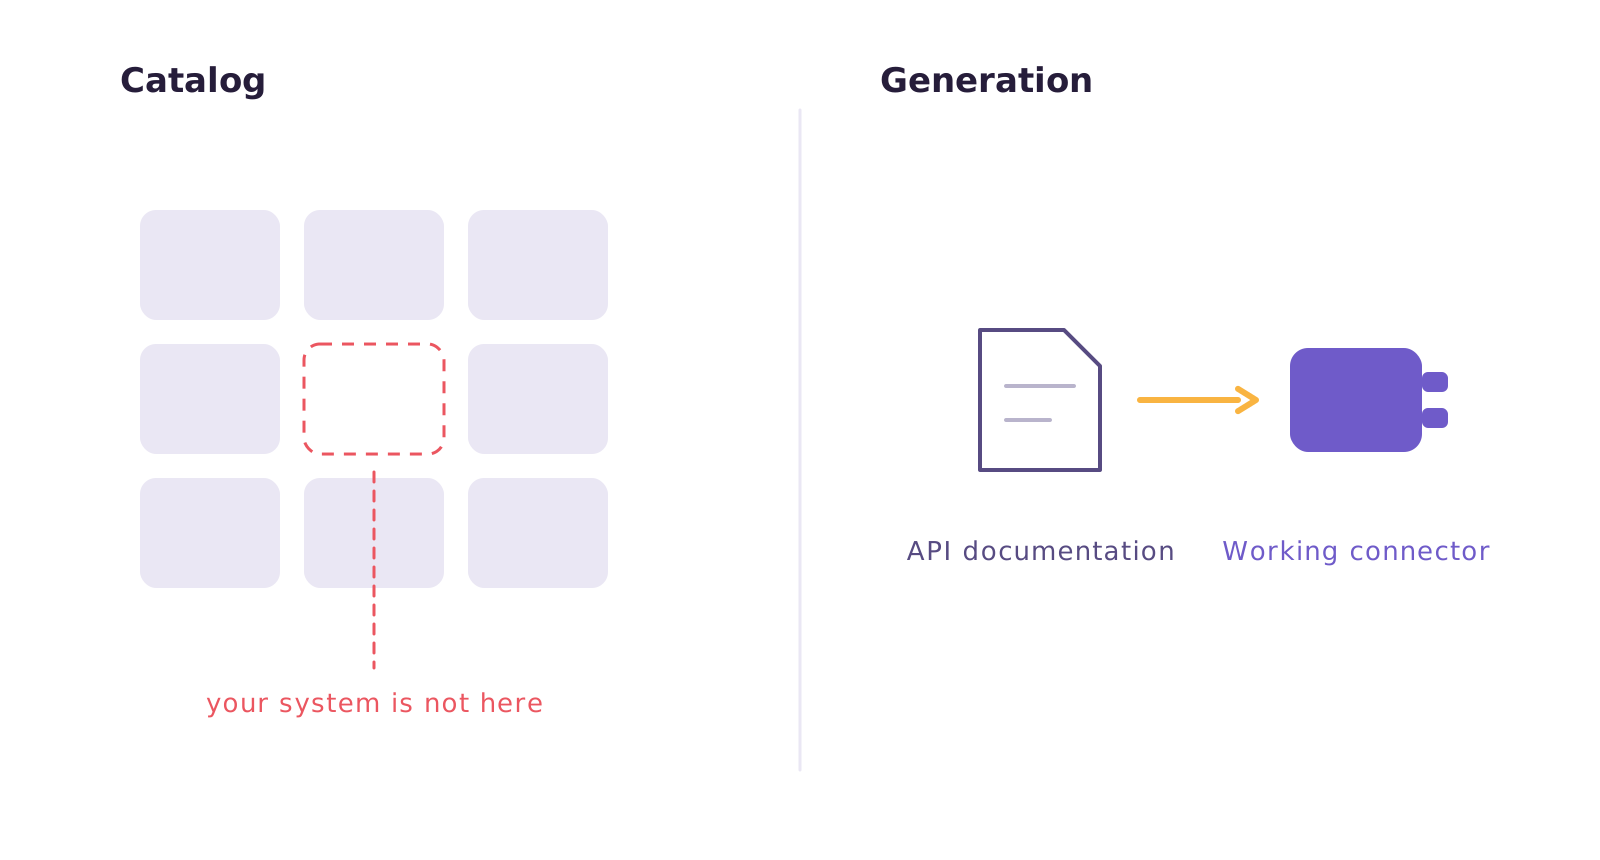
The two approaches solve opposite problems. A catalog wins with popular systems. Generation wins with the system no catalog has: your team's internal API, your industry's system, the niche software the operation has run for ten years.
A concrete example
A network of clinics uses Bling for finance and a custom-built scheduling system. Kondado connects Bling in minutes and does not connect the custom system, which is in no catalog at all. Januss generates both from documentation: Bling's, which is public, and the custom system's. One solves half the case; the other solves the case.
The direct question is worth asking: how many of your sources are in a catalog, and how many are not?
What you can do with the data afterwards
Both platforms transform in SQL, at the destination, and neither requires Python or dbt. The difference is in what happens before and after the SQL.
Before, Januss handles format during the load itself. Thirteen chainable per-column conversion rules — currency, date, number, text, regular expression, value map — across eight regional formats. R$ 1.234,56 becomes a number and 19/08/2026 becomes a date with no glue script in between. And you decide, column by column, whether an invalid value stops the run or is written empty.
After, Januss applies declared tests to the result: not null, unique, accepted values, referential integrity or a query of your own. Each test can stop the pipeline or simply warn. Stopping means the wrong number never reaches the dashboard.
And the pipeline does not keep hammering at an error. After three failures in a row it switches itself off, instead of burning your allowance failing in silence.
Kondado calls its transformations models: SQL triggered alongside the integrations, materialized and documented field by field, which helps whoever consumes them later.
"Bad data does not get through" is a product decision, not an optional feature.
Where the data is processed
Januss encrypts database passwords in your browser, before they leave your machine. The platform stores the encrypted package and never opens it — only the executor does, at the moment of the run.
There is an SSH tunnel for a database that is not exposed, and execution happens in the region you choose: Brazil or the United States.
And when the data cannot leave the network, there is the Runner. It is a component installed inside your own infrastructure, talking to Januss over a single outbound connection on port 443. Extraction, transformation and loading all happen in there. No inbound firewall rule.
Kondado states that data stays in the customer's cloud and describes the use of established cloud providers. There is no equivalent component in the public material for running inside the customer's network.
If your legal team has already blocked a tool over this, that item weighs more than all the others combined.
What happens when volume goes over
Both models are volume-based, and that is where the similarity stops.
In Januss, the bill is per row written at the destination, counting every step that writes. Anything past your allowance is billed per additional million, and each plan has a cap the invoice will not exceed — always lower than the next plan's monthly fee. High volume does not become a surprise on the invoice: it becomes the cap.
Kondado bills on two limits: active integrations and records successfully inserted at the destination. A record is a row of up to 500 bytes, so 10,000 rows adding up to 10 MB count as 20,000 records. When you hit the limit before the month is over, integrations are paused automatically until the cycle turns over.
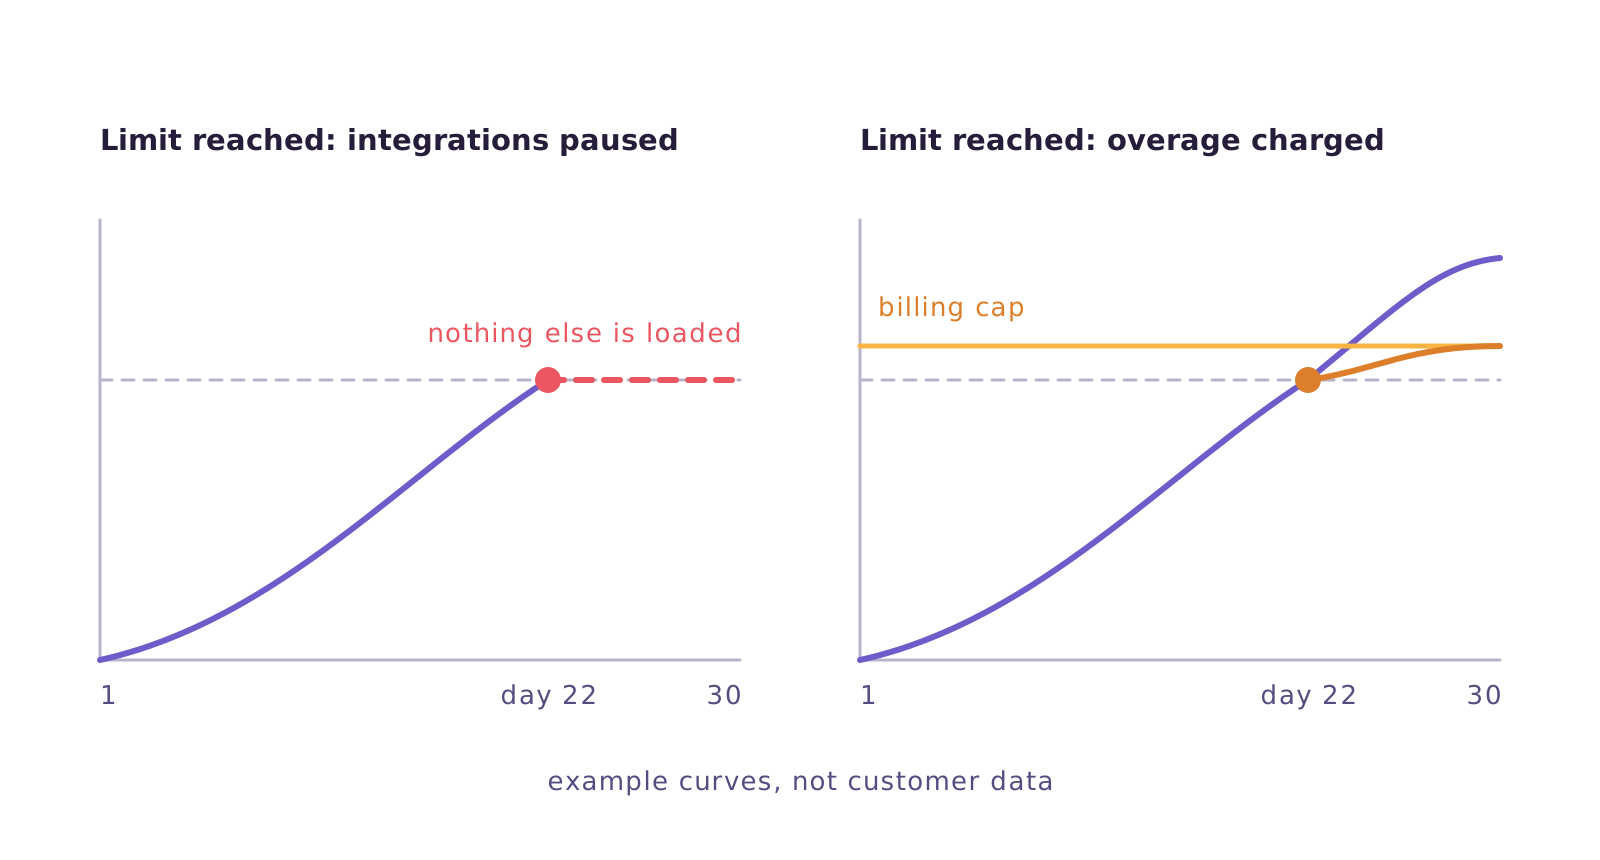
They are two opposite answers to the same risk. One protects your wallet and stops the pipeline. The other keeps the pipeline running and caps the bill. The question is a single one: on the day your volume goes over, what hurts less — a stale report or a bigger invoice?
How to decide
Four questions settle most cases:
1. Do you need to know how the data changed? If your analysis depends on history, or on knowing what was deleted, you need log reading.
2. Are all of your sources in a catalog? All of them in, and the catalog wins. Any of them outside, and generation from documentation starts to matter.
3. Can your data leave your network? If it cannot, the conversation starts and ends with the local execution component.
4. When volume goes over, what hurts less? A paused pipeline or a bigger invoice. There is no right answer — there is yours.
Where Januss comes in
Januss was built for the scenario where the data lives in a database, history matters and not every source fits in a catalog.
Transaction log reading on five databases, from the entry plan up. Sync mode chosen per table, including versioned history. An API connector generated from documentation and validated by a real call before saving. Thirteen per-column conversion rules. Tests that stop the pipeline before the wrong number reaches the dashboard. Execution inside your own network through the Runner, when that is the case. And a billing cap in the contract.
If that is your scenario, the list above is not a brochure: it is the product.
Want to compare it against your own case? It is a 14-day trial, no credit card: create your workspace.
Create your workspace in minutes.
Point at your source and watch the data reach its destination the same day.